A cause-and-effect diagram is a graphical tool used to identify, organize, and communicate the potential causes of a specific problem or quality characteristic. Also known as a “fishbone” or Ishikawa diagram, a cause-and-effect diagram is an efficient way to visually display the relationship between factors. In business settings, cause and effect diagrams are commonly used to identify the root causes of problems so that action can be taken to prevent a recurrence.
How Cause and Effect Diagrams Work
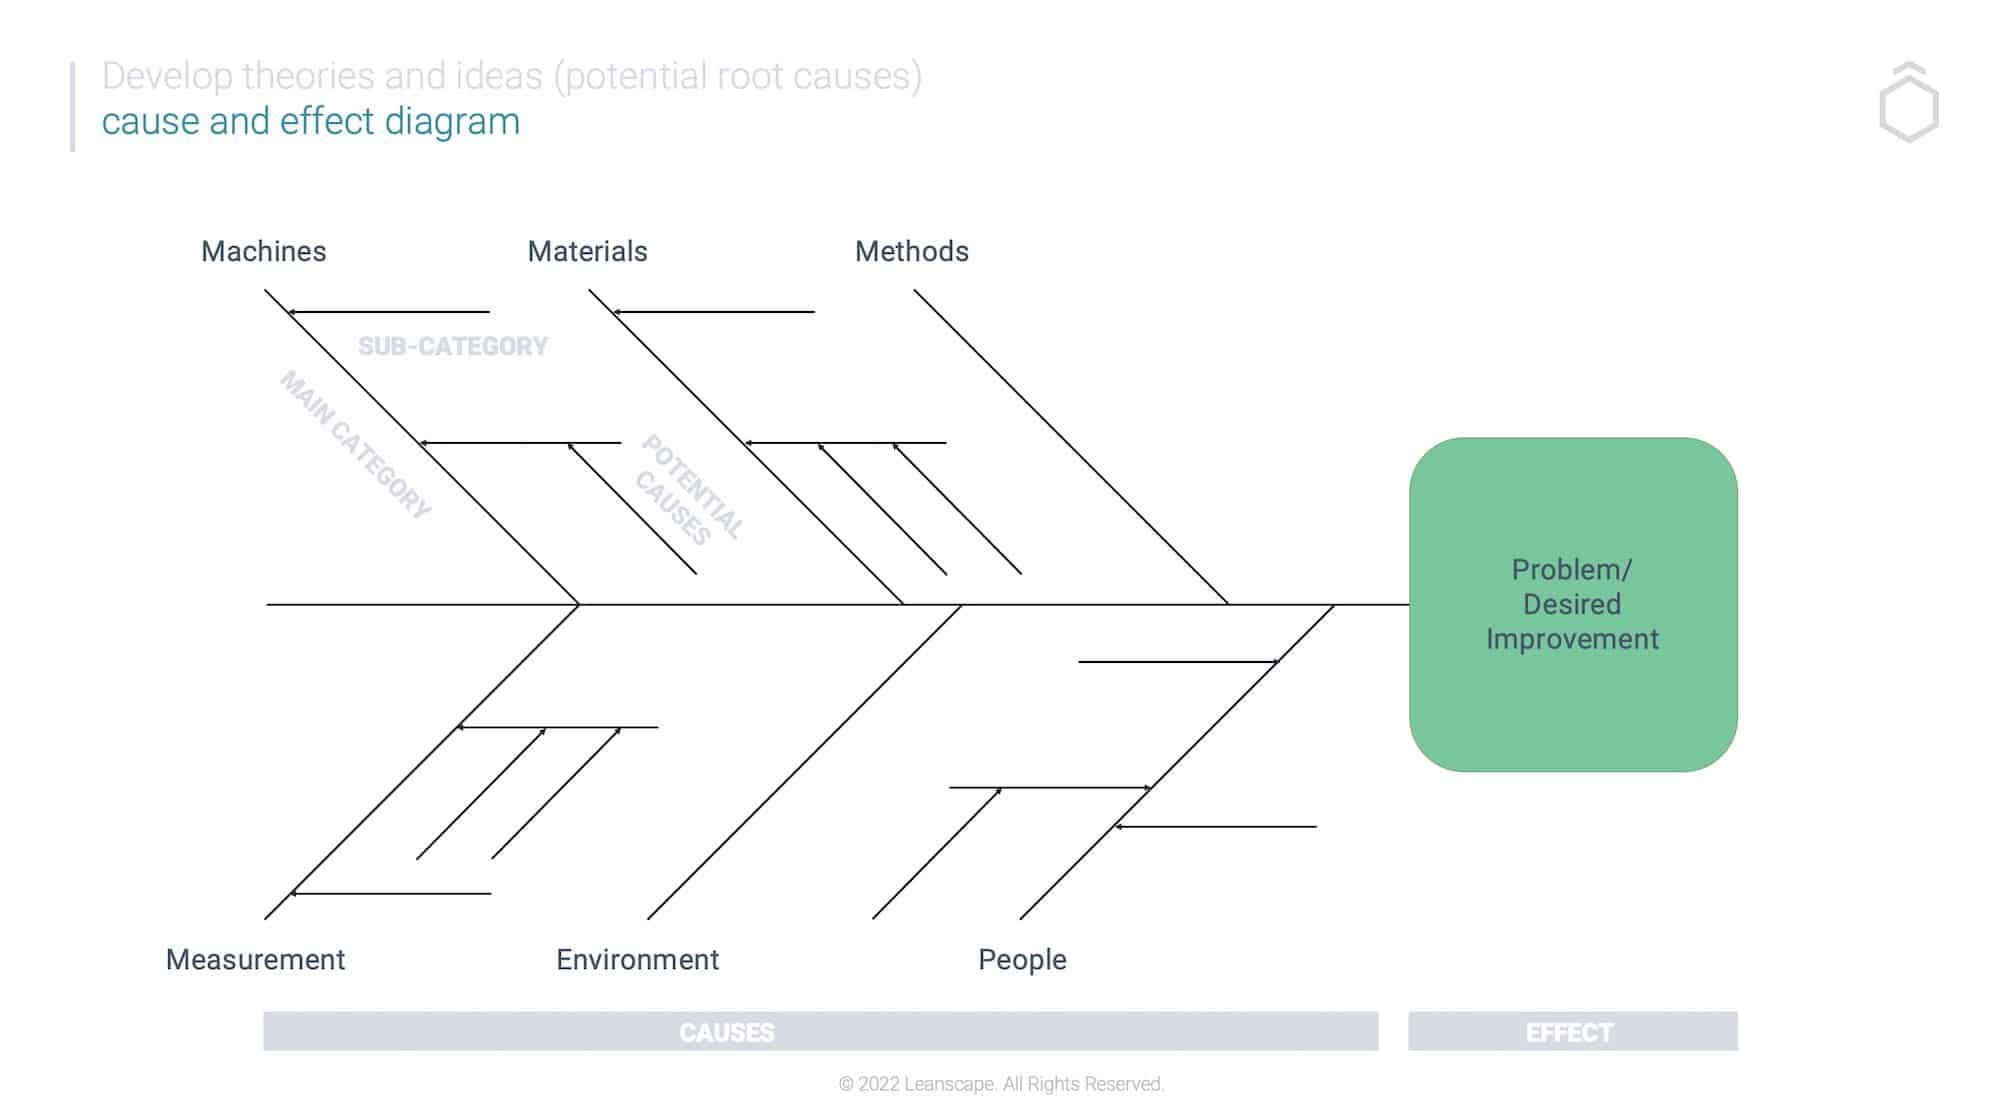
A cause and effect diagram is constructed with a definite purpose: to identify all possible causes of a particular problem or event. To do this, the diagram uses a central spine to represent the problem or event under investigation. This is then flanked by branches representing different categories of potential causes. These branches can be organized in any way that makes sense for the particular problem or event being investigated—common ways of categorizing causes include functions, materials, processes, departments, people, etc.
Once the branches have been determined, the next step is to populate each branch with specific causes. This is where the “cause and effect” part of the cause and effect diagram comes into play. For each specific cause, you identify, ask yourself, “What effect does this have on the problem or event?” By doing this, you can ensure that all of the potential causes of the problem are accounted for in your cause-and-effect diagram.
A cause-and-effect diagram is a graphical tool used to identify, organize, and communicate the potential causes of a specific problem or quality characteristic. Also known as a “fishbone” or Ishikawa diagram, a cause-and-effect diagram is an efficient way to visually display the relationship between factors. In business settings, cause and effect diagrams are commonly used to identify the root causes of problems so that action can be taken to prevent a recurrence.
How to Create a Cause and Effect Diagram
There are six steps involved in creating a cause-and-effect diagram:
1. Identify the problem or quality characteristic in question. Write this in the center of the head of the fish of a piece of paper or whiteboard, draw a rectangle around it, and label it “Problem.”
2. Brainstorm potential causes of the problem. These could be categorized by major groups such as the 6M’s: materials, methods, machinery, manpower (people), environment (mother nature) , measurement, or management. Draw arrows coming out from the Problem rectangle and write the influential groups around the outside of the diagram.
3. For each major group, brainstorm specific sub-causes. Write these down inside the relevant box and connect them to the main category with arrows.
4. Once you have exhausted all possible causes, it’s time to start looking for root causes—the underlying reasons why the problem is occurring. To do this, ask “Why?” for each cause until you get an answer that cannot be further divided into smaller parts. These are your root causes.
5. After identifying root causes, you can start developing solutions. To do this, ask, “What can be done to eliminate this cause?” for each root cause listed in your diagram. Be sure to involve relevant stakeholders in this step to make potential solutions realistic and achievable.
6. Solutions should be designed to address root causes, not symptoms—otherwise, there is a risk that the problem will reoccur once implementation is complete. Review your proposed solutions against this criterion before finalizing your action plan.
Conclusion:
A cause-and-effect diagram is a valuable tool for business professionals who want to identify the root causes of problems quickly and efficiently. Although it may take some time to create a comprehensive diagram, doing so can save significant time and resources in the long run by preventing recurring problems.right had